Difference between revisions of "File:GQRX legend one.png"
(uploaded a new version of "File:GQRX legend one.png") |
|||
| (One intermediate revision by the same user not shown) | |||
| Line 1: | Line 1: | ||
| − | a | + | While GQRX is being used as an example, most waterfall tuners have the following elements: 1 The waterfall shows your slice of spectrum in time, the top of the waterfall represents the most recent. The waterfalls usually show the background noise as blue. 2 The signal, colored yellow to red depending on the intensity of the signal. 2a The same signal in a graph representation, the 'peaks' represent signals, the 'valleys' the noise floor. 3 The tuner, here you can input a frequency in MHZ to tune in to. Either by clicking, using the arrow keys or inputting a number. 4 This bar show which slice of the spectrum you are currently viewing. Scroll on it to 'zoom'. 5 This shows the strength of the signal (the closer to 0 the stronger). 6 The demodulated audio signal, use the slider increase the 'gain' (or volume) of the received audio. 7b Arguably the most important part: the tuner. If you click anywhere on the graph or waterfall, you will move this around. Try to click on the middle of your signal. 7: This shows the width of the filter, make sure this covers the entire signal, otherwise you are filtering out a part of the signal you want to hear. |
Latest revision as of 13:46, 21 September 2016
While GQRX is being used as an example, most waterfall tuners have the following elements: 1 The waterfall shows your slice of spectrum in time, the top of the waterfall represents the most recent. The waterfalls usually show the background noise as blue. 2 The signal, colored yellow to red depending on the intensity of the signal. 2a The same signal in a graph representation, the 'peaks' represent signals, the 'valleys' the noise floor. 3 The tuner, here you can input a frequency in MHZ to tune in to. Either by clicking, using the arrow keys or inputting a number. 4 This bar show which slice of the spectrum you are currently viewing. Scroll on it to 'zoom'. 5 This shows the strength of the signal (the closer to 0 the stronger). 6 The demodulated audio signal, use the slider increase the 'gain' (or volume) of the received audio. 7b Arguably the most important part: the tuner. If you click anywhere on the graph or waterfall, you will move this around. Try to click on the middle of your signal. 7: This shows the width of the filter, make sure this covers the entire signal, otherwise you are filtering out a part of the signal you want to hear.
File history
Click on a date/time to view the file as it appeared at that time.
| Date/Time | Thumbnail | Dimensions | User | Comment | |
|---|---|---|---|---|---|
| current | 18:15, 12 September 2016 |  | 1,600 × 900 (888 KB) | Rra (talk | contribs) | |
| 17:57, 12 September 2016 | 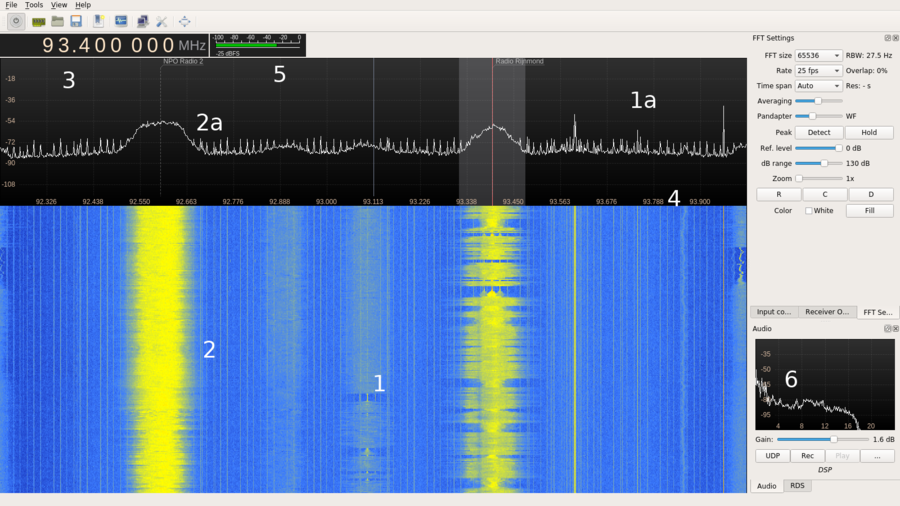 | 1,600 × 900 (887 KB) | Rra (talk | contribs) | a legend to explain what happens on each part of the GQRX interface |
- You cannot overwrite this file.
File usage
The following page uses this file: