Difference between revisions of "RTL-SDR"
| Line 31: | Line 31: | ||
== the interface == | == the interface == | ||
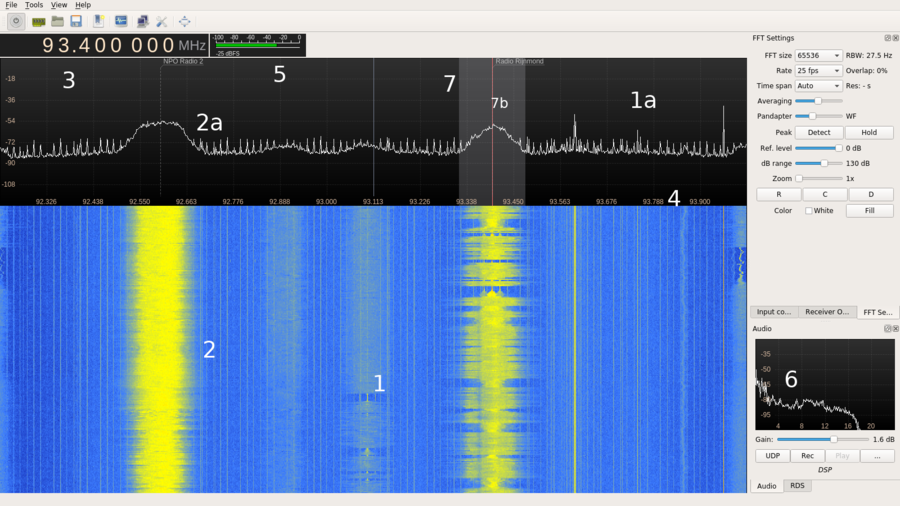
| − | [[File:GQRX_legend_one.png | Elements of the GQRX interface. While GQRX is being used as an example, most waterfall tuners have the following elements: '''1''' The waterfall shows your slice of spectrum in time, the top of the waterfall represents the most recent. The waterfalls usually show the background noise as blue. '''2''' The signal, colored yellow to red depending on the intensity of the signal. '''2a''' The same signal in a graph representation, the 'peaks' represent signals, the 'valleys' the noise floor. '''3''' The tuner, here you can input a frequency in MHZ to tune in to. Either by clicking, using the arrow keys or inputting a number. '''4''' This bar show which slice of the spectrum you are currently viewing. Scroll on it to 'zoom'. '''5''' This shows the strength of the signal (the closer to 0 the stronger). '''6''' The demodulated audio signal, use the slider increase the 'gain' (or volume) of the received audio. '''7b''' Arguably the most important part: the tuner. If you click anywhere on the graph or waterfall, you will move this around. Try to click on the middle of your signal. '''7''': This shows the width of the filter, make sure this covers the entire signal, otherwise you are filtering out a part of the signal you want to hear. | + | [[File:GQRX_legend_one.png | Elements of the GQRX interface. While GQRX is being used as an example, most waterfall tuners have the following elements: '''1''' The waterfall shows your slice of spectrum in time, the top of the waterfall represents the most recent. The waterfalls usually show the background noise as blue. '''2''' The signal, colored yellow to red depending on the intensity of the signal. '''2a''' The same signal in a graph representation, the 'peaks' represent signals, the 'valleys' the noise floor. '''3''' The tuner, here you can input a frequency in MHZ to tune in to. Either by clicking, using the arrow keys or inputting a number. '''4''' This bar show which slice of the spectrum you are currently viewing. Scroll on it to 'zoom'. '''5''' This shows the strength of the signal (the closer to 0 the stronger). '''6''' The demodulated audio signal, use the slider increase the 'gain' (or volume) of the received audio. '''7b''' Arguably the most important part: the tuner. If you click anywhere on the graph or waterfall, you will move this around. Try to click on the middle of your signal. '''7''': This shows the width of the filter, make sure this covers the entire signal, otherwise you are filtering out a part of the signal you want to hear. | 500px | frame | left ]] |
| + | |||
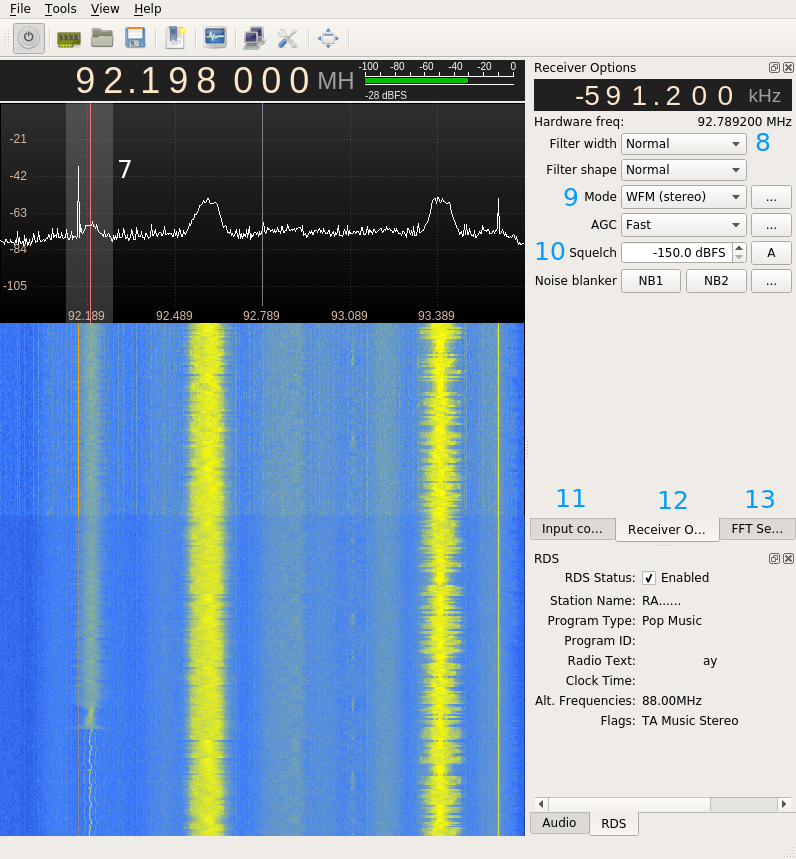
| + | [[File:GQRX_legend_two.png |frame|left| '''7''' You can change the width of the filter by dragging it sideways. '''8''' Alternatively you can use some widely used presets. '''9''' This lets you choose the demodulation, without it you will not hear anything. So always double check your modulation settings. '''10''' Squelch allows you to set a lower limit to when audio is played, this is very usefull for filtering out the noise floor so the receiver is quiet untill it receives a signal. The number corresponds with the numbers on the left of the graph. '''11''' The input tab lets you control some of the hardware settings of the USB dongle (depending on the model you have). '''12''' Receiver options contains important settings such as the demodulation scheme. '''13''' FFT Settings lets you change the look and resolution of the waterfall and graph. Especially usefull if the software is running slow for you. If that is the case change the FFT Size and Rate to lower numbers. ]] | ||
Revision as of 06:06, 13 September 2016
Contents
What is SDR (Software Defined Radio)?
The main idea behind SDR is to replace components in radios that are traditionally hardware (such as filters, mixers and amplifiers) by software algorithms. An SDR thus receives ‘everything’ it can receive and sends that to the computer to be processed. These datastreams take a lot of CPU to be processed, so it is not always ideal. However, SDR allows you to receive signals on frequencies which are otherwise very difficult to receive.
RTL-SDR
SDR became popular and affordable a few years ago through RTL-SDR. RTL-SDR uses DVB (digital television) dongles based on specific (Real Tek) chips which, as people found out by accident, can be made to receive a much wider band of signals than DVB. Depending on the chipsets RTL-SDR can receive roughly between 22mhz and 2200mhz.
To use it you need to get a RTL-SDR compatible dongle (here's a list http://sdr.osmocom.org/trac/wiki/rtl-sdr) and install drivers and software to control it.
SDR Software
For the SDR to work you will need to install two types of software: drivers and the tuning software. The drivers allow your computer to talk to the SDR dongle, the tuning software allow you to interact with it and receive signals.
There is a variety of tuning software to control your SDR with, from the very complex to relatively simple suites. For this workshop we will focus on simple but powerfull visual software, for later projects you might want to look into specific terminal utilities.
The typical interface for most SDR tuning software is the so-called waterfall. This is a spectrogram of the signal to noise ratio on a given slice of the spectrum which plotted in time. Usually showing blue as the noise floor and any signals als yellow/red depending on the signal strength. As time passes the past signals scroll downwards like a waterfall. This allows you to visually discover signals, even after they have stopped transmitting, rather than having to be tuned in at the right time to hear them.
Recommended software
GQRX (MacOSX) http://gqrx.dk/
SDR# (Windows) http://airspy.com/download/
install tips windows: http://www.rtl-sdr.com/rtl-sdr-quick-start-guide/
the interface

