File:GQRX legend one.png

Original file (1,600 × 900 pixels, file size: 888 KB, MIME type: image/png)
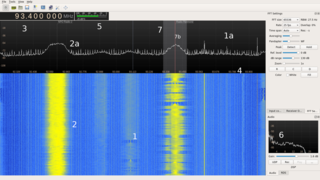
a legend to explain what happens on each part of the GQRX interface
Elements of the GQRX interface. While GQRX is being used as an example, most waterfall tuners have the following elements: 1 The waterfall shows your slice of spectrum in time, the top of the waterfall represents the most recent. The waterfalls usually show the background noise as blue. 2 The signal, colored yellow to red depending on the intensity of the signal. 2a The same signal in a graph representation, the 'peaks' represent signals, the 'valleys' the noise floor. 3 The tuner, here you can input a frequency in MHZ to tune in to. Either by clicking, using the arrow keys or inputting a number. 4 This bar show which slice of the spectrum you are currently viewing. Scroll on it to 'zoom'. 5 This shows the strength of the signal (the closer to 0 the stronger). 6 The demodulated audio signal, use the slider increase the 'gain' (or volume) of the received audio. 7b Arguably the most important part: the tuner. If you click anywhere on the graph or waterfall, you will move this around. Try to click on the middle of your signal. 7: This shows the width of the filter, make sure this covers the entire signal, otherwise you are filtering out a part of the signal you want to hear.
File history
Click on a date/time to view the file as it appeared at that time.
| Date/Time | Thumbnail | Dimensions | User | Comment | |
|---|---|---|---|---|---|
| current | 18:15, 12 September 2016 | | 1,600 × 900 (888 KB) | Rra (talk | contribs) | |
| 17:57, 12 September 2016 |  | 1,600 × 900 (887 KB) | Rra (talk | contribs) | a legend to explain what happens on each part of the GQRX interface |
- You cannot overwrite this file.
File usage
The following page uses this file: