User:Sjoerdlegue
Contents
How to be Human
By Sjoerd Legué (sjoerdlegue@gmail.com)
Student Product Design (0902887)
Sensitivity Training
For me, Digital Craft started with the Sensitivity Training. As a team we were assigned a certain analog sensor, where the question was how the relation could be found between man and machine.
Research:
We chose a heat-sensor as subject. During the research we found an interesting contradiction. An electronic and human heat sensor work kind of the same with electronic impulses. What makes them different is the perception and procession of the ‘data’.
The human brain and it’s sensors have a built-in limit and idea of what is (too) hot or not. An electrical sensor does not. This concept is what we wanted to explain in the series of three videos.
Video 1
The first video explains that raw sensor data can be perceived in multiple ways. The numbers on itself don’t say anything that humans can understand. And when you want to understand them then there are multiple types of measurement where temperature can be defined in (Celsius, Fahrenheit and Kelvin).
Video 1
Video 2
Our second video is a sequel to the first one, where we display heat as a human-understandable way. We found out that humans can measure heat between -15 and 68 degrees Celsius. Cells and the nerve system will damage under and above these temperatures. We tried to visualise this by displaying temperature in grayscales, where black is the coldest and white the hottest measureable temperature.
Video 2
Video 3
And the third and last video is another step towards the relativity of electronic and human sensors. We combined everything we’ve learned and found before into a small installation where we wanted to try to introduce the Herzian Tales principle. Creating unease when trying to use the device we’ve built. This is done by applying a score to holding your hand above a flame. This will be painful after some time, but to achieve a higher score you will have to endure that.
Video 3
Installation
As a final piece to How to be Human we made the theory we learned into a physical piece. During the video research we found out that there are a lot of different methods to measure heat. One of these methods was through thermo-sensitive material. This, often plastic, material contains thermochromic paint that reacts to a combination of moisture and heat. The filament we found turns transparent when it 'detects' heat. The fact that the material becomes slightly translucent could be used to make image or text appear and disappear. After trying some samples and showing them to others, we found out that the material on itself was already interesting.
The shape of the object that we made is a reference to the so called human magnetic field. This torus shape thus also the shape we wanted to go with. Not only because it is a reference to human energy but also because the shape allows itself to be touched with the entire hand and also allows fingers to be moved across the shape.
For our presentation, we decided to also make a poster. The title 'energy flows were the attention goes' gives the user some kind of mystery in touching the object and figure out what it does. This installation basically registers the influence of your body heat for a short amount of time as some kind of analog heat sensor.
Mind of the Machine
This project is all about artificial intelligence, computer creativity and machine learning algorythms.
Research:
In the lecture of Boris Smeenk and Arthur Boer we learned about an algorithm that reconstructs images taken from a datasheets, collected from different sources on the internet. This algorithm processes large datasets in where it tries to learn about it's composition, color and shapes. With the help of a discriminator, the algorythm generates new images based on what it has learned from those feeded sets of data. Every iteration that is runs it tries to recreate an image that looks or can be defined as something that the sourcedata also could have given to the algorythm.
Based on this theory we learned, we fed the algorythm 500 different kinds of Pokémon. The logic behind this is that Pokémon all look very similar in style, with their black borders, vibrant color use and cartoon-like style. With as goal to try to generate the new generation of Pokémon!
Project Awareness
By Sjoerd Legué (sjoerdlegue@gmail.com)
Student Product Design (0902887)
Individual Project
Change of Direction:
In the brainstorm section, I've described that I wanted to do something with Open Data. This has changed, the current project does have stuff to do with data, but more with the processing of it. In september there is "De week van de Eenzaamheid" in Rotterdam. This event addresses the fact that loneliness is a serious issue in the Netherlands and thus requires needful attention. For this event, I have been asked to come up with a digital installation that makes people aware of the fact that loneliness can be something very close to everyone.
Concept:
The concept of my project is to address people personally, through a live videofeed and animation, that people themselves can help prevent loneliness amongst elderly around them. This is addressed through asking people personal questions about (for instance) when they have called their own grandma or grandpa.
Medium:
To reach people personally for this concept I want to process a live video feed (that is positioned on the first floor of Rotterdam Station) and track traveling people that are at the station. The video feed is going to be beamed on a canvas that is visible for everyone who walks at the station, or is visiting the website of our foundation (omaspopup.nl). For the project I am going to use a small single-board computer like the Raspberry Pi and it's compatible camera. I have chosen for this method because the entire project has to be small in size, to be able to fit underneath the canvas.
Documentation
Hardware
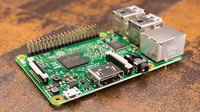
Raspberry Pi (model 3B+):
As described above, using a small processing computer allows me to use the installation in a narrow space. I also won't prefer placing a very expensive computer like a Mac to be placed in such a public space.
RasPi Camera (rev. 1.3):
This is the native supported webcam for the Raspberry Pi. This on-board camera can be connected to the computer very easily and is broadly supported across all of it's software.
RasPi 7" Touchscreen Display:
I use this touchscreen to display and read information directly from the Raspberry Pi itself. The computing board is attached on the back of the display, which makes the format of the installation even smaller.
Software
Python:
The entire program that drives the camera, and the recording/generating of the images, is written in Python. This programming language is quite easy to learn and is also very readable. I do have a lot of experience with other web-based programming languages, but I have never worked in Python before. So as an unexperienced programmer in Python, the language is very much recommendable for people who are new in programming.
Dependencies
Raspbian Jessie:
Before installing any dependencies, do not forget to update and upgrade the Advanced Packages Tool.
sudo apt-get update
sudo apt-get upgrade
reboot
OpenCV 3:
OpenCV is a library that allows easy access for image manipulation and processing. Installing it for the Raspberry Pi takes quite some time and can be difficult for people who are new into Linux. I used this tutorial for the complete installation. This website (pyimagesearch.com is also very helpful and has an extensive set of tutorials about OpenCV + Python on the Raspberry Pi.
PiCamera:
This is the driver of the on-board camera. No need for installing the package, it comes natively with Raspberry OS Jessie. When having your camera connected, check availability like this:
vcgencmd get_camera
Matplotlib:
For the creation of the GIF image, additional libraries were needed. Matplotlib is a plotting library that supports the animation of GIF's. Although the dependency can be quite slow, it has excellent native support for OpenCV and PiCamera. Installing it did not take very long, I used this small tutorial for installing the libraries. Do not forget to install ImageMagick library too when using this, it is not described anywhere in the tutorial. Small topic on the subject here.
sudo apt-get update
sudo apt-get install imagemagick
Python, JSON:
All installed natively, I think. If not, just give the error a Google search and browse some forums.
Process
Collecting Data
The first step in my process was to collect data through video. I have tried multiple other things, before settling with the Raspi Camera module. Other video recorders, like a generic webcam and the Microsoft Kinect did not work properly with the Raspberry Pi. They would require a lot of tweaking and fiddling around before being able to use them. This was the moment I stumbled upon the Raspberry Pi Camera module. I played around with the source from pyimagesearch.com that I found and did some research on the camera and it's documentation. At this point, I was still working in Node.js. But that programming language did not match my requirements and could not 'communicate' as easily with the camera module as Python would.
Before switching to Python, I have been trying to create a proper setup for collecting some datasets from within my living room.
Writing Code
After having made the decision to switch to Python, I have been searching on the internet for other similar projects. I always think it is better to learn from something similar, then to try reinventing everything all over again. I stumbled upon a project from a Belgian person named Cedric Verstraeten. He has made a motion detection system for OpenCV in C++ (see github link). Some of his elements (like the motion blocking) is very clever and has been the inspiration for me to take on a similar approach. I combined the ideas of Cedric and pyimagesearch.com into my own Python-based motion detection system.
Testing
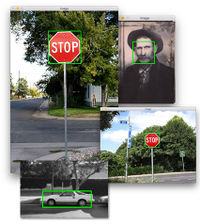
The image on the right is a snapshot of an early prototype of the detection system. Since that version a lot of filtering and calculating has been added. To be able to predict motion and detect wether motion in two frames are the same requires complex calculations and a lot of loops. At this point, the system is capable of assigning ID's to certain motion regions, excluding zones from being able to 'have' motion, assign persistency to motion regions and track persistent motion.
Finetuning
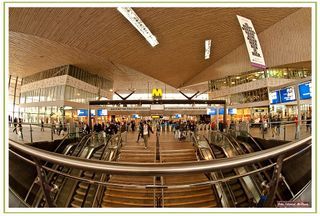
To be able to say that the code will work in the final location, a test in Rotterdam Central station was mandatory. Taking the project with me was not possible, since there are no public power sockets available at the stations. I had to video capture the hallway on my phone and downscale the files to how the Raspberry Pi camera would capture the scene. With these recordings, I have fine tuned the delta (motion difference) and persistency thresholds. This means that when placing the installation at the station, it should work as programmed.
Code
Setup:
All used code files are within this .zip file. Just extract them, navigate to the location and run motion.py as administrator.
cd motion/
sudo python motion.py
Files
Media:Motion.zip (bestandgrootte: 2Mb)
Brainstorm
The moment I knew what I wanted to do:
For a long time I have known that Product Design was the right decision for me to choose. This also means that there was or is not a certain kind of image that reflects this moment for me. But IKEA has always inspired me to look at products (in the literal term) in a very different way. For instance the IKEA Concept Kitchen (IKEA Concept Kitchen 2025).
What do I make?
Although I have chosen for product design, my background lays in graphic- and digital design. Together with Emmy Jaarsma, I have made several hat designs over the course of a few years. Our best work even won the International Hat Designer of the Year award in 2013. For the hat, I mainly designed the digital pattern for the laser-cutter.
Topic of Interest:
For this practice I want to explore the concept of Open Data. It fascinates me that a lot of information is freely accessible on the internet to be used and processed and that everyone can contribute to this gigantic heap of information. Almost everything is on the internet, at least when you search for it with the right parameters.
Medium:
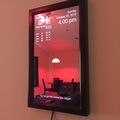
The main component I wish to use is a microcontroller (or small computer) with access to the internet. It should be able to search for the information by itself and process that into a visual attractive element that is easily readable by human beings. A good example of a very cool project is the Magic Mirror. It's just like a regular mirror, but it displays important information for the consumer to know.
Result
At the final stage of the development Project Awareness is calculate and record a lot of elements. The project is not fully complete, but the most difficult part of the video installation is complete. A brief preview of the execution of the software:
Before the project can be displayed at the station in Rotterdam, a lot of the visual part has yet to be designed. In my opinion, the best way to design the visuals is to create a dynamic HTML5 + JavaScript website that communicated with an other Python script that pushes new GIF files to the site. By using a website the generated GIF's can be 'prettified' a lot easier than with Python. Combining CSS with JavaScript creates a dynamic and good cross-platform framework to be able to spread the message as good as possible.


